監控與診斷:pg_stat 視圖、pg_stat_statements 與 Prometheus 可觀測性 | PostgreSQL
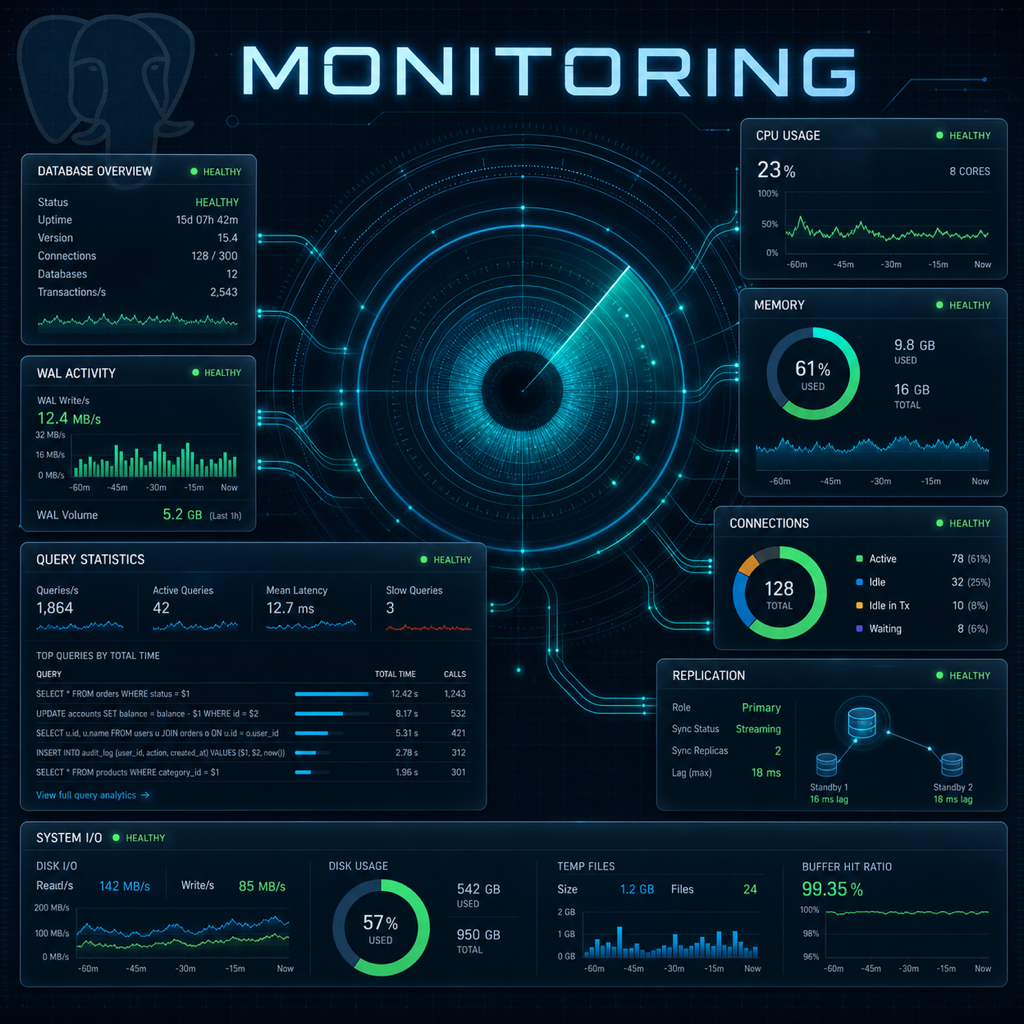
PostgreSQL 內建豐富的統計資訊視圖(Statistics Views),從連線狀態、查詢效能、表與索引健康到 WAL 寫入量,幾乎所有關鍵指標都可透過 SQL 查詢取得。搭配 Prometheus、Grafana 和 pgBadger 等外部工具,可以建立完整的可觀測性(Observability)體系。本篇將從內建視圖到外部監控平台,全面剖析 PostgreSQL 監控與診斷的實務知識。
統計資訊架構演進
PostgreSQL 的統計資訊收集機制在 PG15 經歷了重大改進:
PG14 及更早 — Stats Collector 程序架構:
  Backend Process 1 ──UDP──┐
  Backend Process 2 ──UDP──┤──► Stats Collector ──► pgstat 檔案
  Backend Process N ──UDP──┘     (獨立程序)       (磁碟持久化)
         ▲
         │ 讀取統計資訊
  pg_stat_* views(從磁碟讀取,有延遲)


PG15+ — Shared Memory 架構(重大改進):
  Backend Process 1 ──┐
  Backend Process 2 ──┤──► Shared Memory 統計資訊區塊
  Backend Process N ──┘    (無需程序間通訊)
         ▲
         │ 直接讀取
  pg_stat_* views(即時,延遲更低)
PG15+ 消除了 Stats Collector 程序,統計資訊直接寫入共享記憶體,避免了 UDP 封包遺失與延遲問題,資料更即時也更準確。
監控層次金字塔
完整的 PostgreSQL 監控涵蓋多個層次:
┌──────────────────────────────────────────────────┐
│                 監控層次金字塔                     │
├──────────────────────────────────────────────────┤
│  Level 6:應用層      查詢延遲、錯誤率            │
│  Level 5:查詢層      pg_stat_statements          │
│  Level 4:連線層      pg_stat_activity             │
│  Level 3:表/索引層   pg_stat_user_tables/indexes  │
│  Level 2:WAL/I/O 層  pg_stat_wal, pg_stat_io     │
│  Level 1:Buffer/BG 層 pg_stat_bgwriter           │
│  Level 0:OS 層       CPU、RAM、Disk I/O          │
└──────────────────────────────────────────────────┘
| 監控類型 | 說明 | 工具範例 |
|---|---|---|
| 被動監控 | 定期抓取指標,事後分析 | Prometheus scrape、pgBadger |
| 主動監控 | 即時查詢、告警觸發 | pg_stat_activity、auto_explain |
| 日誌分析 | 事後解析日誌檔 | pgBadger、ELK Stack |
| APM 整合 | 應用層追蹤到 SQL 層 | OpenTelemetry、Datadog |
pg_stat_activity:連線即時監控
pg_stat_activity 是最常用的監控視圖,顯示所有目前連線的即時狀態。
核心欄位
SELECT
    pid,              -- 程序 ID
    usename,          -- 使用者
    application_name, -- 應用程式名稱
    client_addr,      -- 客戶端 IP
    state,            -- 連線狀態:active / idle / idle in transaction
    wait_event_type,  -- 等待事件類型
    wait_event,       -- 具體等待事件
    query_start,      -- 當前查詢開始時間
    query             -- 當前/最後執行的 SQL
FROM pg_stat_activity;
連線狀態統計
-- 依狀態統計連線數
SELECT
    state,
    count(*) AS count,
    max(EXTRACT(EPOCH FROM (now() - state_change)))::int AS max_seconds
FROM pg_stat_activity
WHERE pid <> pg_backend_pid()
GROUP BY state
ORDER BY count DESC;

-- 輸出範例:
-- state                | count | max_seconds
-- active               |    12 |           0
-- idle                 |    45 |        3600
-- idle in transaction  |     2 |          45  ← 需注意!
idle in transaction 表示已開啟 Transaction 但尚未提交,這會持有鎖定並阻止 VACUUM。建議設定自動超時:
-- 設定 idle in transaction 自動超時
SET idle_in_transaction_session_timeout = '5min';

-- 或在 postgresql.conf 全域設定(毫秒)
-- idle_in_transaction_session_timeout = 300000
長時間查詢識別
-- 找出執行超過 5 分鐘的查詢
SELECT
    pid,
    usename,
    state,
    wait_event_type,
    EXTRACT(EPOCH FROM (now() - query_start))::int AS duration_seconds,
    left(query, 200) AS query_snippet
FROM pg_stat_activity
WHERE state = 'active'
  AND query_start < now() - INTERVAL '5 minutes'
  AND pid <> pg_backend_pid()
ORDER BY duration_seconds DESC;
阻塞查詢偵測
-- 找出鎖定阻塞鏈(PG9.6+)
SELECT
    pid,
    pg_blocking_pids(pid) AS blocked_by,
    left(query, 100) AS query,
    state,
    wait_event_type,
    wait_event
FROM pg_stat_activity
WHERE cardinality(pg_blocking_pids(pid)) > 0;
取消與終止連線
-- pg_cancel_backend:取消當前查詢(連線保留)
SELECT pg_cancel_backend(12345);

-- pg_terminate_backend:終止整個連線
SELECT pg_terminate_backend(12345);

-- 批次終止 idle in transaction 超過 10 分鐘的連線
SELECT pg_terminate_backend(pid)
FROM pg_stat_activity
WHERE state = 'idle in transaction'
  AND state_change < now() - INTERVAL '10 minutes'
  AND pid <> pg_backend_pid();
pg_stat_user_tables:表健康檢查
Seq Scan vs Index Scan 比率
-- 分析各表的掃描模式
SELECT
    relname AS table_name,
    seq_scan,
    idx_scan,
    CASE
        WHEN seq_scan + idx_scan = 0 THEN 'N/A'
        ELSE round(100.0 * idx_scan / (seq_scan + idx_scan), 2)::text || '%'
    END AS index_scan_ratio,
    n_live_tup AS live_tuples,
    n_dead_tup AS dead_tuples
FROM pg_stat_user_tables
WHERE n_live_tup > 1000
ORDER BY seq_scan DESC
LIMIT 20;

-- 高 seq_scan 且資料量大的表,通常需要新增索引
Dead Tuple 健康檢查
-- Dead Tuple 比率與 VACUUM 時間
SELECT
    relname AS table_name,
    pg_size_pretty(pg_total_relation_size(relid)) AS total_size,
    n_live_tup,
    n_dead_tup,
    round(100.0 * n_dead_tup / NULLIF(n_live_tup + n_dead_tup, 0), 1) AS dead_pct,
    last_autovacuum::date AS last_vac,
    last_autoanalyze::date AS last_analyze
FROM pg_stat_user_tables
WHERE n_live_tup > 5000
ORDER BY dead_pct DESC NULLS LAST
LIMIT 15;

-- Dead ratio 超過 10-20% 通常表示 VACUUM 不夠頻繁
pg_stat_bgwriter / pg_stat_checkpointer
這些視圖監控 Background Writer 和 Checkpoint 的行為。PG16+ 將 Checkpoint 統計從 pg_stat_bgwriter 分離至 pg_stat_checkpointer。
-- Buffer 寫入來源比例分析(PG15 及以下)
SELECT
    buffers_checkpoint AS chkpt_bufs,
    buffers_clean AS bgwriter_bufs,
    buffers_backend AS backend_bufs,
    round(100.0 * buffers_backend /
        NULLIF(buffers_checkpoint + buffers_clean + buffers_backend, 0), 1
    ) AS backend_pct
FROM pg_stat_bgwriter;

-- backend_pct > 10%:shared_buffers 可能不足
-- 或 bgwriter 跟不上寫入速度
-- Checkpoint 觸發模式分析
SELECT
    checkpoints_timed,
    checkpoints_req,
    round(100.0 * checkpoints_req /
        NULLIF(checkpoints_timed + checkpoints_req, 0), 1
    ) AS req_pct
FROM pg_stat_bgwriter;

-- req_pct > 20%:考慮增大 max_wal_size
pg_stat_wal(PG14+)
-- WAL 生成量監控
SELECT
    wal_records,
    pg_size_pretty(wal_bytes) AS wal_size,
    wal_buffers_full,     -- 高值需增大 wal_buffers
    wal_write,
    wal_sync,
    round(wal_write_time::numeric, 2) AS write_time_ms,
    round(wal_sync_time::numeric, 2) AS sync_time_ms
FROM pg_stat_wal;
-- 估算每秒 WAL 生成速率
SELECT
    pg_size_pretty(wal_bytes) AS total_wal,
    pg_size_pretty(
        (wal_bytes / NULLIF(EXTRACT(EPOCH FROM (now() - stats_reset)), 0))::bigint
    ) AS wal_per_second
FROM pg_stat_wal;
pg_stat_io(PG16+)
PG16 引入 pg_stat_io,提供前所未有的 I/O 統計細粒度:
-- Buffer Hit Ratio 分析
SELECT
    backend_type,
    object,
    context,
    hits,
    reads,
    round(100.0 * hits / NULLIF(hits + reads, 0), 2) AS hit_ratio_pct
FROM pg_stat_io
WHERE object = 'relation'
  AND context = 'normal'
  AND (hits + reads) > 0
ORDER BY hit_ratio_pct ASC;

-- 整體 hit_ratio 應 > 95%,理想值 99% 以上
-- PG15 及以下:透過 pg_statio_user_tables 計算
SELECT
    relname,
    heap_blks_hit,
    heap_blks_read,
    round(100.0 * heap_blks_hit /
        NULLIF(heap_blks_read + heap_blks_hit, 0), 2
    ) AS heap_hit_ratio
FROM pg_statio_user_tables
WHERE heap_blks_read + heap_blks_hit > 0
ORDER BY heap_blks_read DESC
LIMIT 20;
pg_stat_statements:查詢效能分析
pg_stat_statements 是最重要的查詢效能分析擴充套件,記錄所有 SQL 的統計資訊。
啟用與設定
-- 安裝擴充套件
CREATE EXTENSION IF NOT EXISTS pg_stat_statements;
# postgresql.conf 必要設定(需重啟)
shared_preload_libraries = 'pg_stat_statements'
pg_stat_statements.max = 10000
pg_stat_statements.track = all
pg_stat_statements.track_utility = on
pg_stat_statements.save = on
Top 查詢分析
-- Top 20 最耗時查詢(by 總執行時間)
SELECT
    round(total_exec_time::numeric / 1000, 2) AS total_secs,
    calls,
    round(mean_exec_time::numeric, 2) AS avg_ms,
    round(stddev_exec_time::numeric, 2) AS stddev_ms,
    rows,
    left(query, 200) AS query
FROM pg_stat_statements
ORDER BY total_exec_time DESC
LIMIT 20;
-- Top 查詢(by 平均耗時)— 找出最慢的單次查詢
SELECT
    calls,
    round(mean_exec_time::numeric, 2) AS avg_ms,
    round(total_exec_time::numeric / 1000, 2) AS total_secs,
    left(query, 300) AS query
FROM pg_stat_statements
WHERE calls >= 10
ORDER BY mean_exec_time DESC
LIMIT 20;
-- Top 查詢(by I/O reads)— 找出最耗 I/O 的查詢
SELECT
    calls,
    round(mean_exec_time::numeric, 2) AS avg_ms,
    shared_blks_read + local_blks_read AS total_reads,
    round(100.0 * (shared_blks_hit + local_blks_hit) /
        NULLIF(shared_blks_read + shared_blks_hit + local_blks_read + local_blks_hit, 0), 2
    ) AS hit_ratio,
    temp_blks_read,
    left(query, 200) AS query
FROM pg_stat_statements
ORDER BY total_reads DESC
LIMIT 20;
查詢正規化
pg_stat_statements 會自動對查詢進行正規化,將常數替換為佔位符:
-- 以下三個查詢被視為同一筆記錄:
SELECT * FROM users WHERE id = 1;
SELECT * FROM users WHERE id = 42;
SELECT * FROM users WHERE id = 999;

-- 正規化後:
-- query: SELECT * FROM users WHERE id = $1
-- calls: 3
等待事件(Wait Events)
等待事件是診斷效能瓶頸的關鍵工具:
-- 即時等待事件快照
SELECT
    wait_event_type,
    wait_event,
    count(*) AS count,
    array_agg(DISTINCT state) AS states
FROM pg_stat_activity
WHERE wait_event IS NOT NULL
  AND pid <> pg_backend_pid()
GROUP BY wait_event_type, wait_event
ORDER BY count DESC;
常見等待事件與對策:
| 等待事件 | 類型 | 可能原因 | 對策 |
|---|---|---|---|
relation | Lock | 表層級鎖定競爭 | 找出持鎖連線 |
transactionid | Lock | 等待其他 TX 提交 | 縮短 Transaction |
WALWrite | IO | WAL 寫入慢 | 改用更快磁碟 |
DataFileRead | IO | 資料讀取慢 | 增大 shared_buffers |
BufFileRead | IO | 排序/Hash 溢出 | 增大 work_mem |
ClientRead | Client | 等待客戶端 | 通常正常 |
BufferContent | LWLock | Buffer 內容鎖爭用 | 分割大表 |
Prometheus + Grafana
Prometheus + postgres_exporter + Grafana 是業界最通用的 PostgreSQL 可觀測性方案。
postgres_exporter 安裝
# Docker 部署
docker run -d \
  --name postgres_exporter \
  -p 9187:9187 \
  -e DATA_SOURCE_NAME="postgresql://monitoring:pwd@localhost:5432/mydb?sslmode=disable" \
  prometheuscommunity/postgres-exporter

# 建立監控專用使用者
CREATE USER monitoring WITH PASSWORD 'strong_password';
GRANT pg_monitor TO monitoring;  -- PG10+ 內建角色
# prometheus.yml
scrape_configs:
  - job_name: 'postgresql'
    static_configs:
      - targets: ['localhost:9187']
    scrape_interval: 30s
關鍵 PromQL 查詢
# 連線使用率(> 80% 告警)
pg_stat_database_numbackends{datname="mydb"} /
pg_settings_max_connections * 100

# TPS(每秒 Transaction 數)
rate(pg_stat_database_xact_commit{datname="mydb"}[5m]) +
rate(pg_stat_database_xact_rollback{datname="mydb"}[5m])

# Cache Hit Ratio(< 95% 告警)
rate(pg_stat_database_blks_hit{datname="mydb"}[5m]) /
(rate(pg_stat_database_blks_hit{datname="mydb"}[5m]) +
 rate(pg_stat_database_blks_read{datname="mydb"}[5m])) * 100

# Replication Lag
pg_replication_lag
自訂 Metrics
# custom_queries.yaml
pg_longest_query:
  query: |
    SELECT max(EXTRACT(EPOCH FROM (now() - query_start))) AS max_seconds
    FROM pg_stat_activity
    WHERE state = 'active' AND query NOT LIKE '%pg_stat_activity%'
  metrics:
    - max_seconds:
        usage: "GAUGE"
        description: "最長執行中查詢的秒數"

pg_idle_in_transaction:
  query: |
    SELECT count(*) AS count
    FROM pg_stat_activity
    WHERE state = 'idle in transaction'
  metrics:
    - count:
        usage: "GAUGE"
        description: "idle in transaction 連線數"
pgBadger:日誌分析
pgBadger 能從 PostgreSQL 日誌產生詳細的 HTML 報告。
日誌設定
# postgresql.conf
log_min_duration_statement = 1000   # 記錄超過 1 秒的查詢
log_line_prefix = '%t [%p]: [%l-1] user=%u,db=%d,app=%a,client=%h '
log_checkpoints = on
log_connections = on
log_disconnections = on
log_lock_waits = on
log_temp_files = 0
log_autovacuum_min_duration = 0
使用
# 安裝
sudo apt install pgbadger  # Ubuntu
brew install pgbadger      # macOS

# 生成報告
pgbadger /var/log/postgresql/postgresql-2026-07-09.log \
  -o /tmp/pgbadger_report.html \
  --format stderr

# 並行分析多日誌
pgbadger /var/log/postgresql/postgresql-2026-07-*.log \
  -o report.html --jobs 4

# 增量分析(每日 cron)
pgbadger --last-parsed /tmp/pgbadger.last \
  /var/log/postgresql/postgresql-$(date +%Y-%m-%d).log \
  -o /var/www/html/pg_report.html
auto_explain:自動記錄執行計劃
auto_explain 能自動將慢查詢的執行計劃記錄到日誌,無需手動 EXPLAIN:
# postgresql.conf
shared_preload_libraries = 'pg_stat_statements,auto_explain'

auto_explain.log_min_duration = 1000    # 記錄超過 1 秒的查詢
auto_explain.log_analyze = on           # 包含實際統計
auto_explain.log_buffers = on           # 包含 Buffer 統計
auto_explain.log_timing = on
auto_explain.log_verbose = on
auto_explain.log_format = text
auto_explain.sample_rate = 1.0          # 採樣率(0.1 = 10%)
-- 無需重啟:Session 層級啟用(測試用)
LOAD 'auto_explain';
SET auto_explain.log_min_duration = 100;
SET auto_explain.log_analyze = on;
告警設計
良好的告警設計應分層避免告警疲勞:
Critical(立即處理):
  - 連線數 > 90% max_connections
  - Replication Lag > 30 秒
  - 磁碟使用率 > 85%
  - Transaction ID 接近 Wraparound(age > 1.5 億)

Warning(48 小時內處理):
  - 連線數 > 75% max_connections
  - Dead Tuple 比率 > 20%
  - Cache Hit Ratio < 95%
  - 存在執行超過 30 分鐘的查詢

Info(每日 Review):
  - 每日 WAL 生成量變化 > 50%
  - pg_stat_statements.dealloc > 0
  - 新出現的大表 Seq Scan
-- Transaction ID Wraparound 風險監控
SELECT
    datname,
    age(datfrozenxid) AS xid_age,
    round(100.0 * age(datfrozenxid) / 2000000000, 2) AS wraparound_pct
FROM pg_database
ORDER BY xid_age DESC;

-- xid_age > 1,500,000,000 應立即告警並強制 VACUUM FREEZE
DBA 工具箱查詢
-- 資料庫整體健康報告
SELECT
    d.datname AS database,
    sa.connections,
    sa.active_queries,
    sa.idle_in_tx,
    round(db.blks_hit * 100.0 /
        NULLIF(db.blks_hit + db.blks_read, 0), 2) AS cache_hit_pct,
    db.xact_commit + db.xact_rollback AS total_xacts,
    db.deadlocks,
    pg_size_pretty(db.temp_bytes) AS temp_bytes
FROM pg_database d
JOIN pg_stat_database db ON db.datid = d.oid
LEFT JOIN LATERAL (
    SELECT
        count(*) AS connections,
        count(*) FILTER (WHERE state = 'active') AS active_queries,
        count(*) FILTER (WHERE state = 'idle in transaction') AS idle_in_tx
    FROM pg_stat_activity WHERE datid = d.oid
) sa ON true
WHERE d.datistemplate = false
ORDER BY d.datname;
-- 未使用索引報告(候選刪除)
SELECT
    schemaname,
    tablename,
    indexname,
    idx_scan AS scans,
    pg_size_pretty(pg_relation_size(indexrelid)) AS size
FROM pg_stat_user_indexes
WHERE idx_scan = 0
ORDER BY pg_relation_size(indexrelid) DESC;
版本演進
| 版本 | 監控改進 |
|---|---|
| PG9.6 | pg_blocking_pids() 引入,阻塞偵測簡化 |
| PG10 | pg_monitor 內建角色,無需 superuser 即可監控 |
| PG13 | pg_stat_statements 新增 WAL 統計欄位 |
| PG14 | pg_stat_wal 引入;pg_stat_statements 新增 plan_time |
| PG15 | Stats Collector 改為 Shared Memory,統計更即時 |
| PG16 | pg_stat_io 引入,I/O 統計前所未有的細粒度 |
| PG17 | pg_stat_checkpointer 從 pg_stat_bgwriter 分離 |
總結
PostgreSQL 監控與診斷的核心要點:
- pg_stat_activity 是即時診斷的第一入口,關注
idle in transaction和長時間查詢 - pg_stat_user_tables 檢查 Dead Tuple 比率和 Seq/Index Scan 比例,評估 VACUUM 與索引健康
- pg_stat_statements 是查詢效能分析的必備工具,關注 Total Time、Mean Time 和 I/O Reads
- 等待事件 是定位效能瓶頸的關鍵,區分 Lock、IO、LWLock 類型採取不同對策
- Prometheus + Grafana 建立持續監控與告警體系,搭配 postgres_exporter 自訂 Metrics
- pgBadger 與 auto_explain 提供事後分析能力,自動記錄慢查詢執行計劃
- 告警分層:Critical / Warning / Info 三級告警避免告警疲勞
下一篇,我們將深入探討 PostgreSQL 組態調校——掌握 shared_buffers、work_mem、effective_cache_size 等關鍵參數的調校策略、工作負載分析方法,以及不同場景的最佳設定方案。